The principle of transparency
Data by year
Financial axis
| School year | Revenues from education | Revenues from scientific research | Proceeds from investment | Revenue from consulting services |
| 2020 | 3% | 0 | 0 | 0 |
| 2021 | 3% | 0 | 0 | 0 |
| 2022 | 3% | 0 | 0 | 0 |

Student axis
| School year | Total number of students (primary and higher) | Number of students by gender | Number of students in primary studies | Number of students in higher studies | Number of students from the governorate's population | Number of students outside the governorate | Number of international students | |
| Male | Female | |||||||
| 2020 | 1377 | 778 | 599 | 1377 | 0 | 1149 | 228 | 0 |
| 2021 | 1699 | 955 | 744 | 1699 | 0 | 1648 | 51 | 0 |
| 2022 | 1762 | 999 | 763 | 1762 | 0 | 1716 | 46 | 0 |

| Academic year | Total number of admitted students | Number of current students by doctorate, master's, bachelor's, graduate and diploma | Total number of graduate students | Number of graduates by doctorate, master's degree, bachelor's degree, higher diploma, and diploma |
| 2020 | 213 | 1377 | 393 | 393 |
| 2021 | 742 | 1699 | 471 | 471 |
| 2022 | 429 | 1762 | 267 | 267 |

Axis of teaching
| School year | Total number of teachers | Number of teachers by gender | Number of teachers on permanent staff | Number of lecturers | Number of foreign teachers | Ratio of students per teacher | |
| Male | Female | ||||||
| 2020 | 69 | 38 | 22 | 60 | 9 | 0 | 20 |
| 2021 | 73 | 45 | 17 | 62 | 10 | 1 | 23.3 |
| 2022 | 32 | 15 | 8 | 23 | 8 | 1 | 55 |

Axis of classifications
| Academic year | University ranking in national rankings (if any) | The university's ranking in international rankings approved by the Ministry |
| 2020 | 56 | 0 |
| 2021 | 53 | 0 |
| 2022 | 50 | 0 |

Financial axis
| School year | Revenues from education | Revenues from scientific research | Proceeds from investment | Revenue from consulting services |
| 2019 | 3% | 0 | 0 | 0 |
| 2020 | 3% | 0 | 0 | 0 |
| 2021 | 3% | 0 | 0 | 0 |

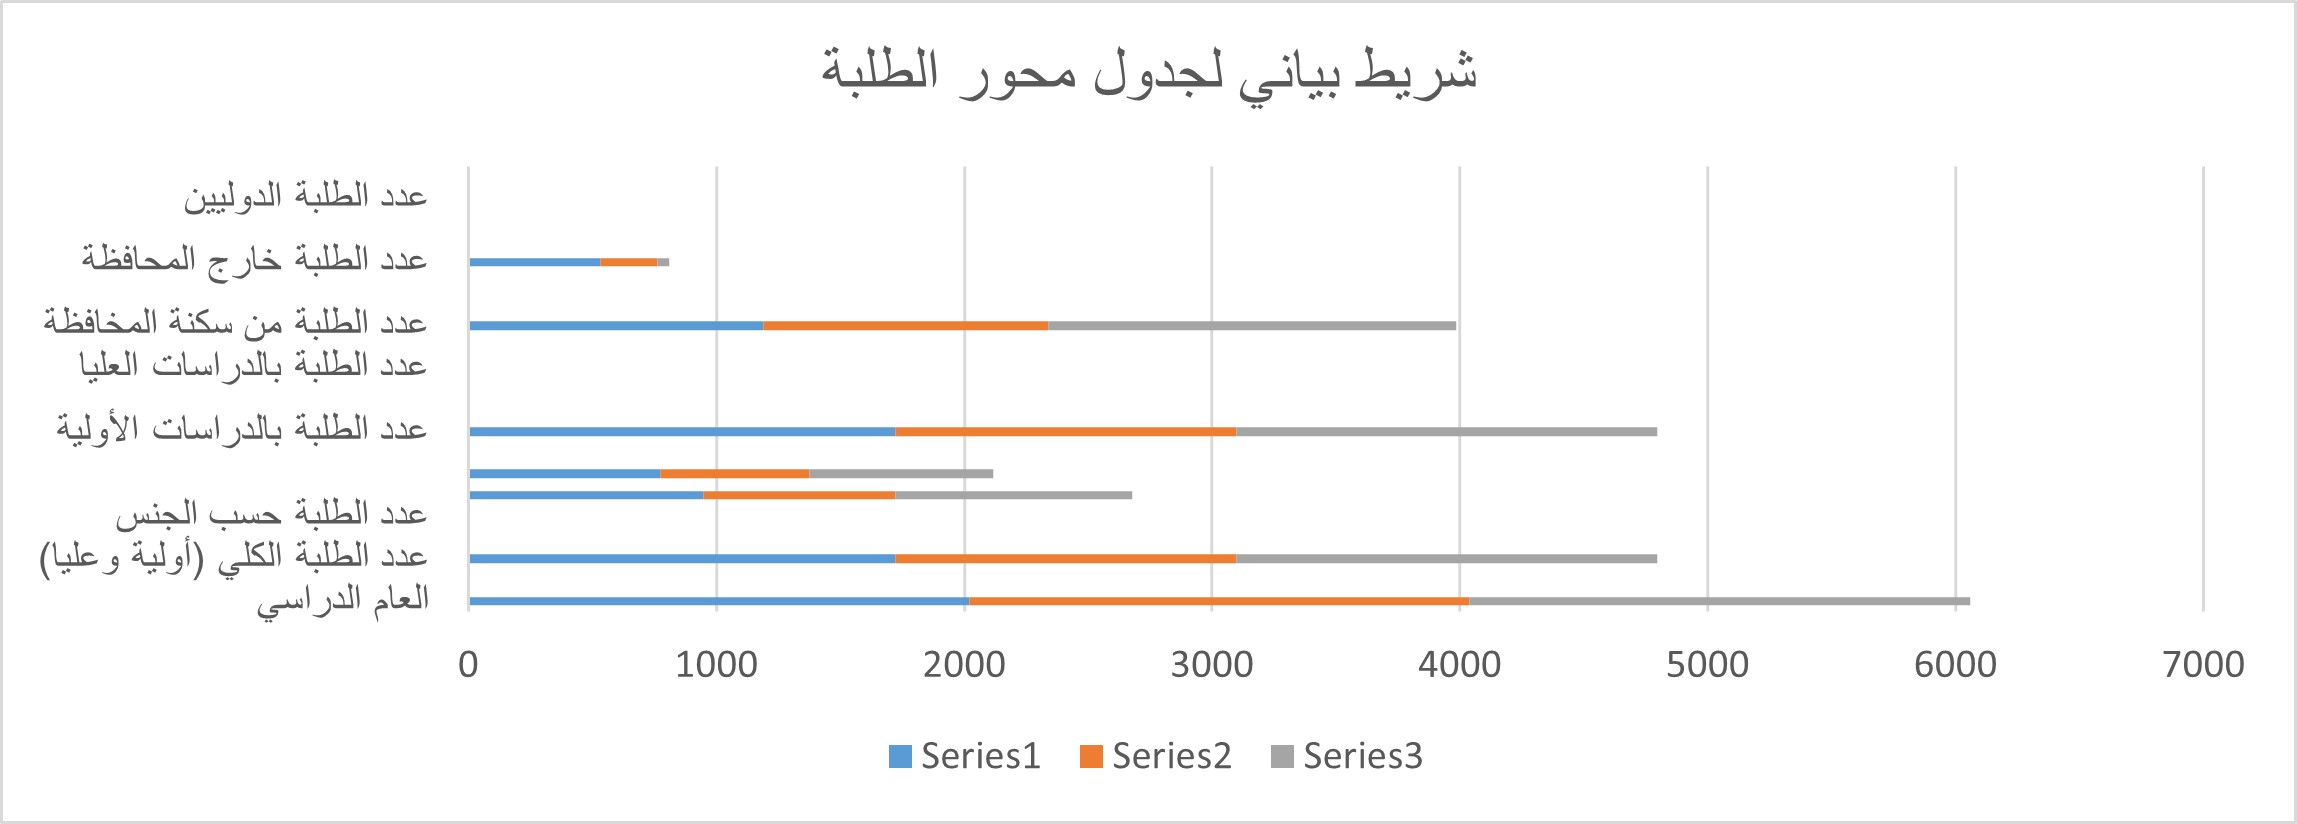
Student axis
| School year | Total number of students (primary and higher) | Number of students by gender | Number of students in primary studies | Number of graduate students | Number of students from the governorate's population | Number of students outside the governorate | Number of international students | |
| Male | Female | |||||||
| 2019 | 1720 | 945 | 775 | 1720 | 0 | 1188 | 532 | 0 |
| 2020 | 1377 | 778 | 599 | 1377 | 0 | 1149 | 228 | 0 |
| 2021 | 1699 | 955 | 744 | 1699 | 0 | 1648 | 50 | 0 |
| Academic year | Total number of admitted students | Number of current students by doctorate, master's, bachelor's, graduate and diploma | Total number of graduate students | Number of graduates by doctorate, master's degree, bachelor's degree, higher diploma, and diploma |
| 2019 | 133 | 1720 | 566 | 566 |
| 2020 | 213 | 1377 | 393 | 393 |
| 2021 | 742 | 1699 | 471 | 471 |

Axis of teaching
| School year | Total number of teachers | Number of teachers by gender | Number of teachers on permanent staff | Number of lecturers | Number of foreign teachers | Ratio of students per teacher | |
| Male | Female | ||||||
| 2019 | 70 | 35 | 22 | 57 | 13 | 0 | 24.6 |
| 2020 | 69 | 38 | 22 | 60 | 9 | 0 | 20 |
| 2021 | 73 | 45 | 17 | 62 | 10 | 1 | 23.3 |

Axis of classifications
| Academic year | University ranking in national rankings (if any) | The university's ranking in international rankings approved by the Ministry |
| 2019 | 56 | 0 |
| 2020 | 56 | 0 |
| 2021 | 53 | 0 |

Financial axis
| School year | Revenues from education | Revenues from scientific research | Proceeds from investment | Revenue from consulting services |
| 2018 | 2% | 0 | 0 | 0 |
| 2019 | 2% | 0 | 0 | 0 |
| 2020 | 3% | 0 | 0 | 0 |

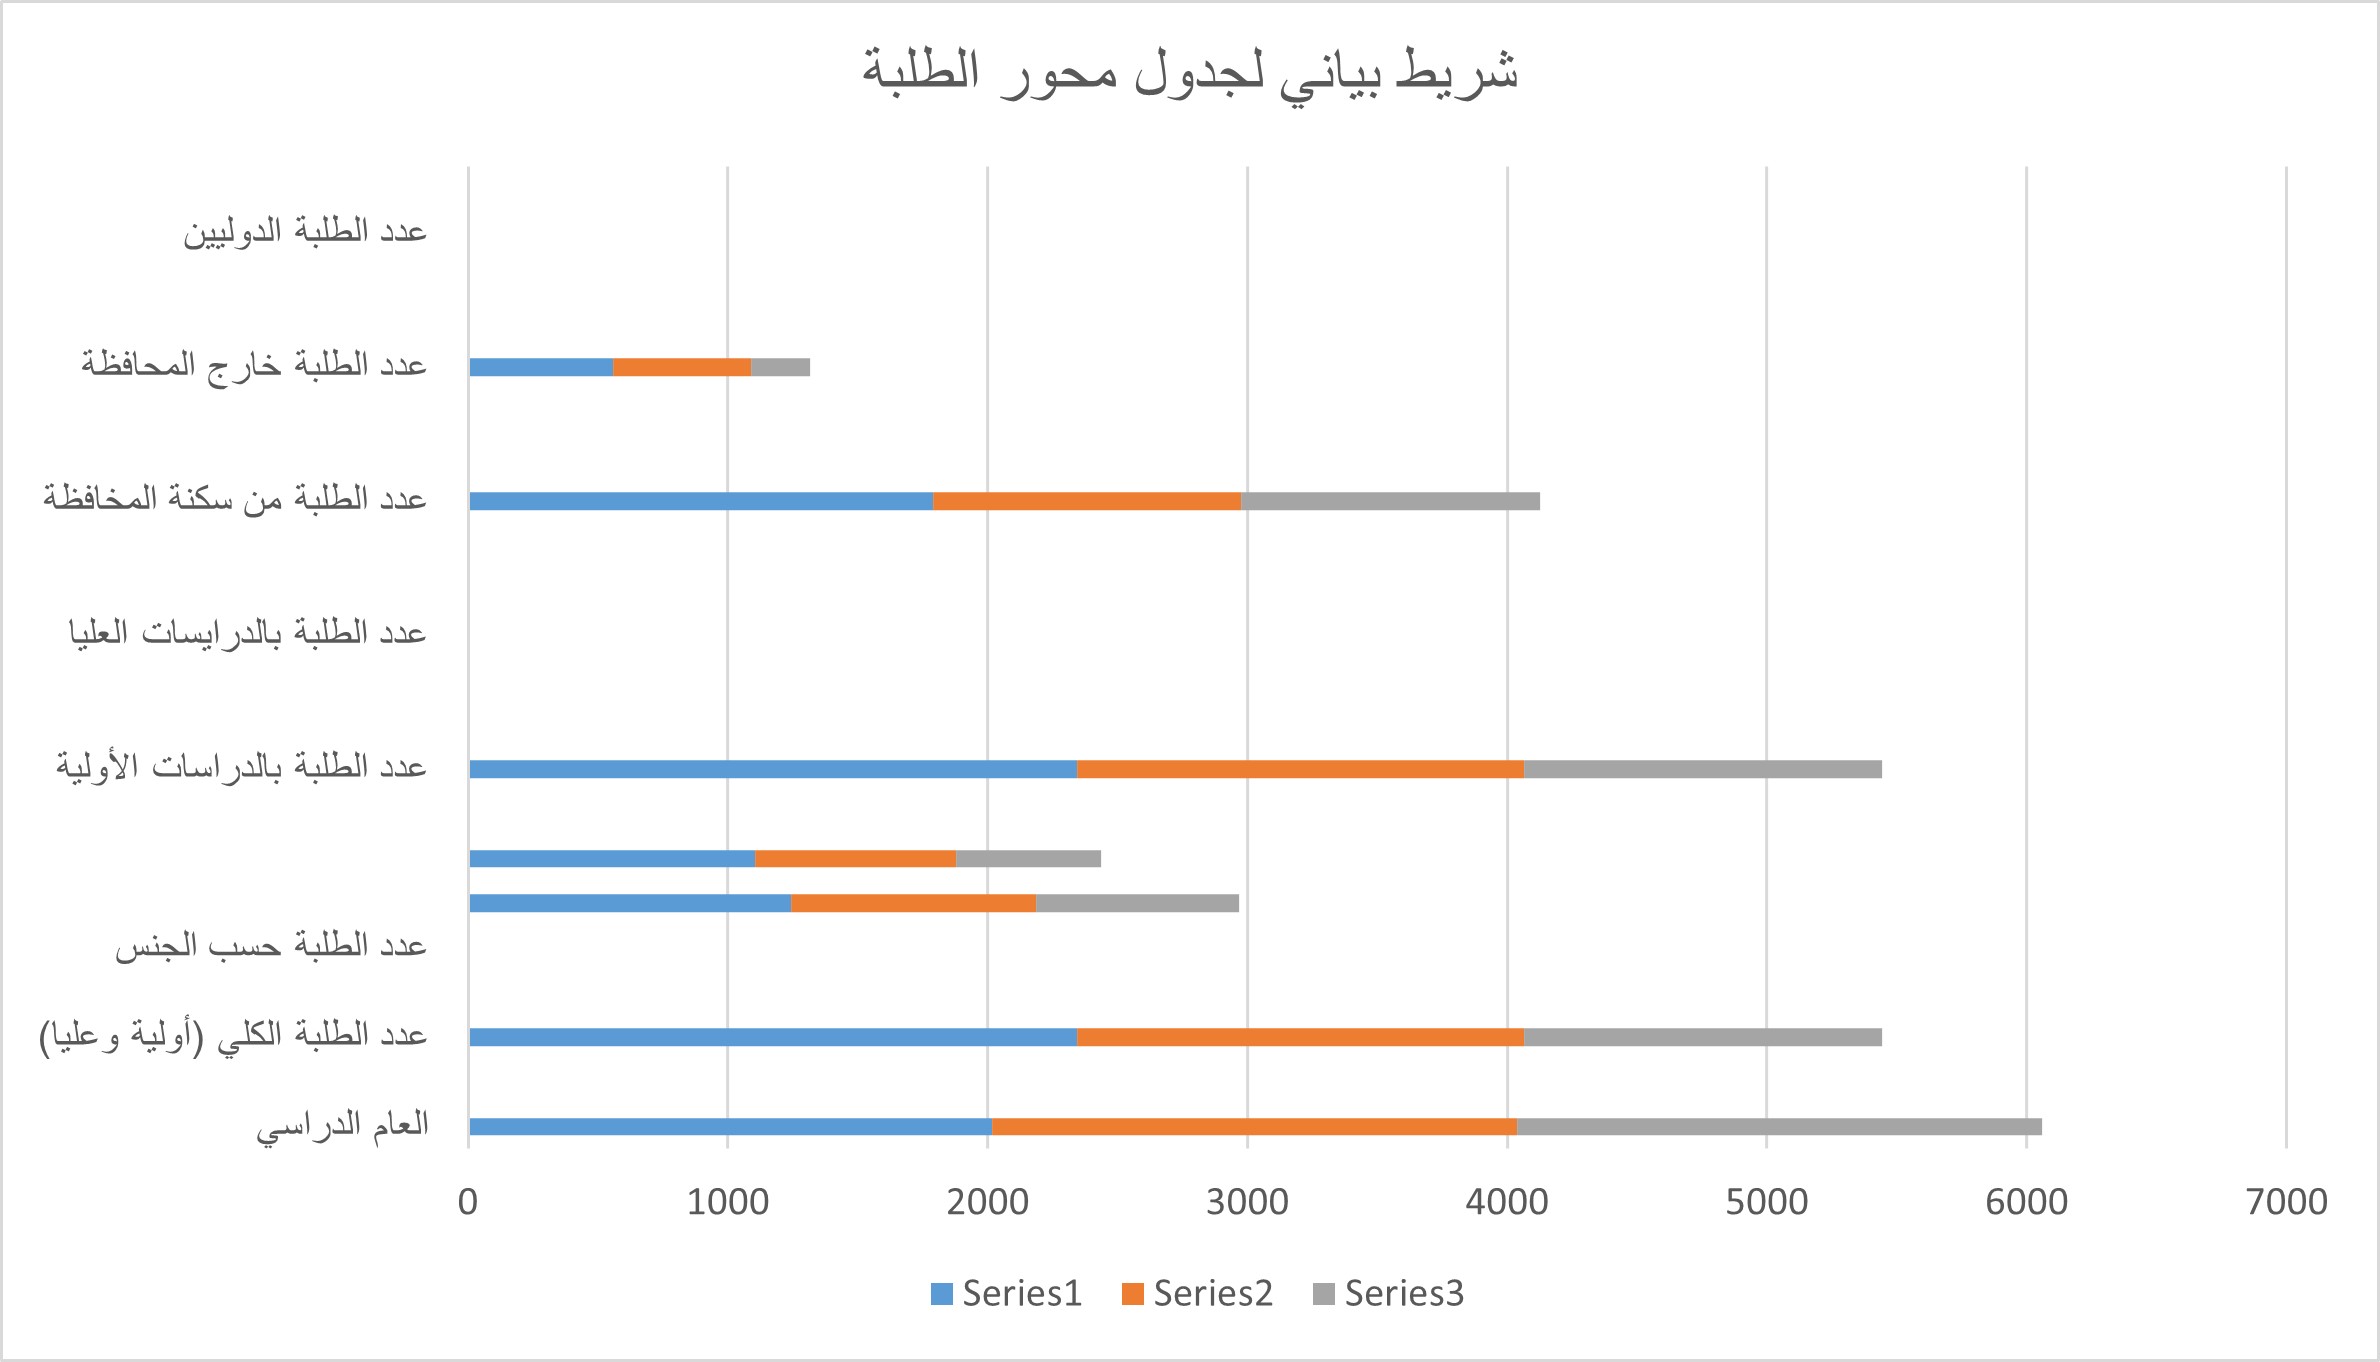
Student axis
| School year | Total number of students (primary and higher) | Number of students by gender | Number of students in primary studies | Number of students in higher studies | Number of students from the governorate's population | Number of students outside the governorate | Number of international students | |
| Male | Female | |||||||
| 2018 | 2346 | 1243 | 1103 | 2346 | 0 | 1788 | 558 | 0 |
| 2019 | 1720 | 945 | 775 | 1720 | 0 | 1188 | 532 | 0 |
| 2020 | 1377 | 778 | 559 | 1377 | 0 | 1149 | 228 | 0 |
| Academic year | Total number of admitted students | Number of current students by doctorate, master's, bachelor's, graduate and diploma | Total number of graduate students | Number of graduates by doctorate, master's degree, bachelor's degree, higher diploma, and diploma |
| 2018 | 464 | 2346 | 719 | 719 |
| 2019 | 133 | 1720 | 566 | 566 |
| 2020 | 213 | 1377 | 393 | 393 |

Axis of teaching
| School year | Total number of teachers | Number of teachers by gender | Number of teachers on permanent staff | Number of lecturers | Number of foreign teachers | Ratio of students per teacher | |
| Male | Female | ||||||
| 2018 | 61 | 31 | 20 | 51 | 10 | 0 | 38.5 |
| 2019 | 70 | 35 | 22 | 57 | 13 | 0 | 24.6 |
| 2020 | 69 | 38 | 22 | 60 | 9 | 0 | 20 |

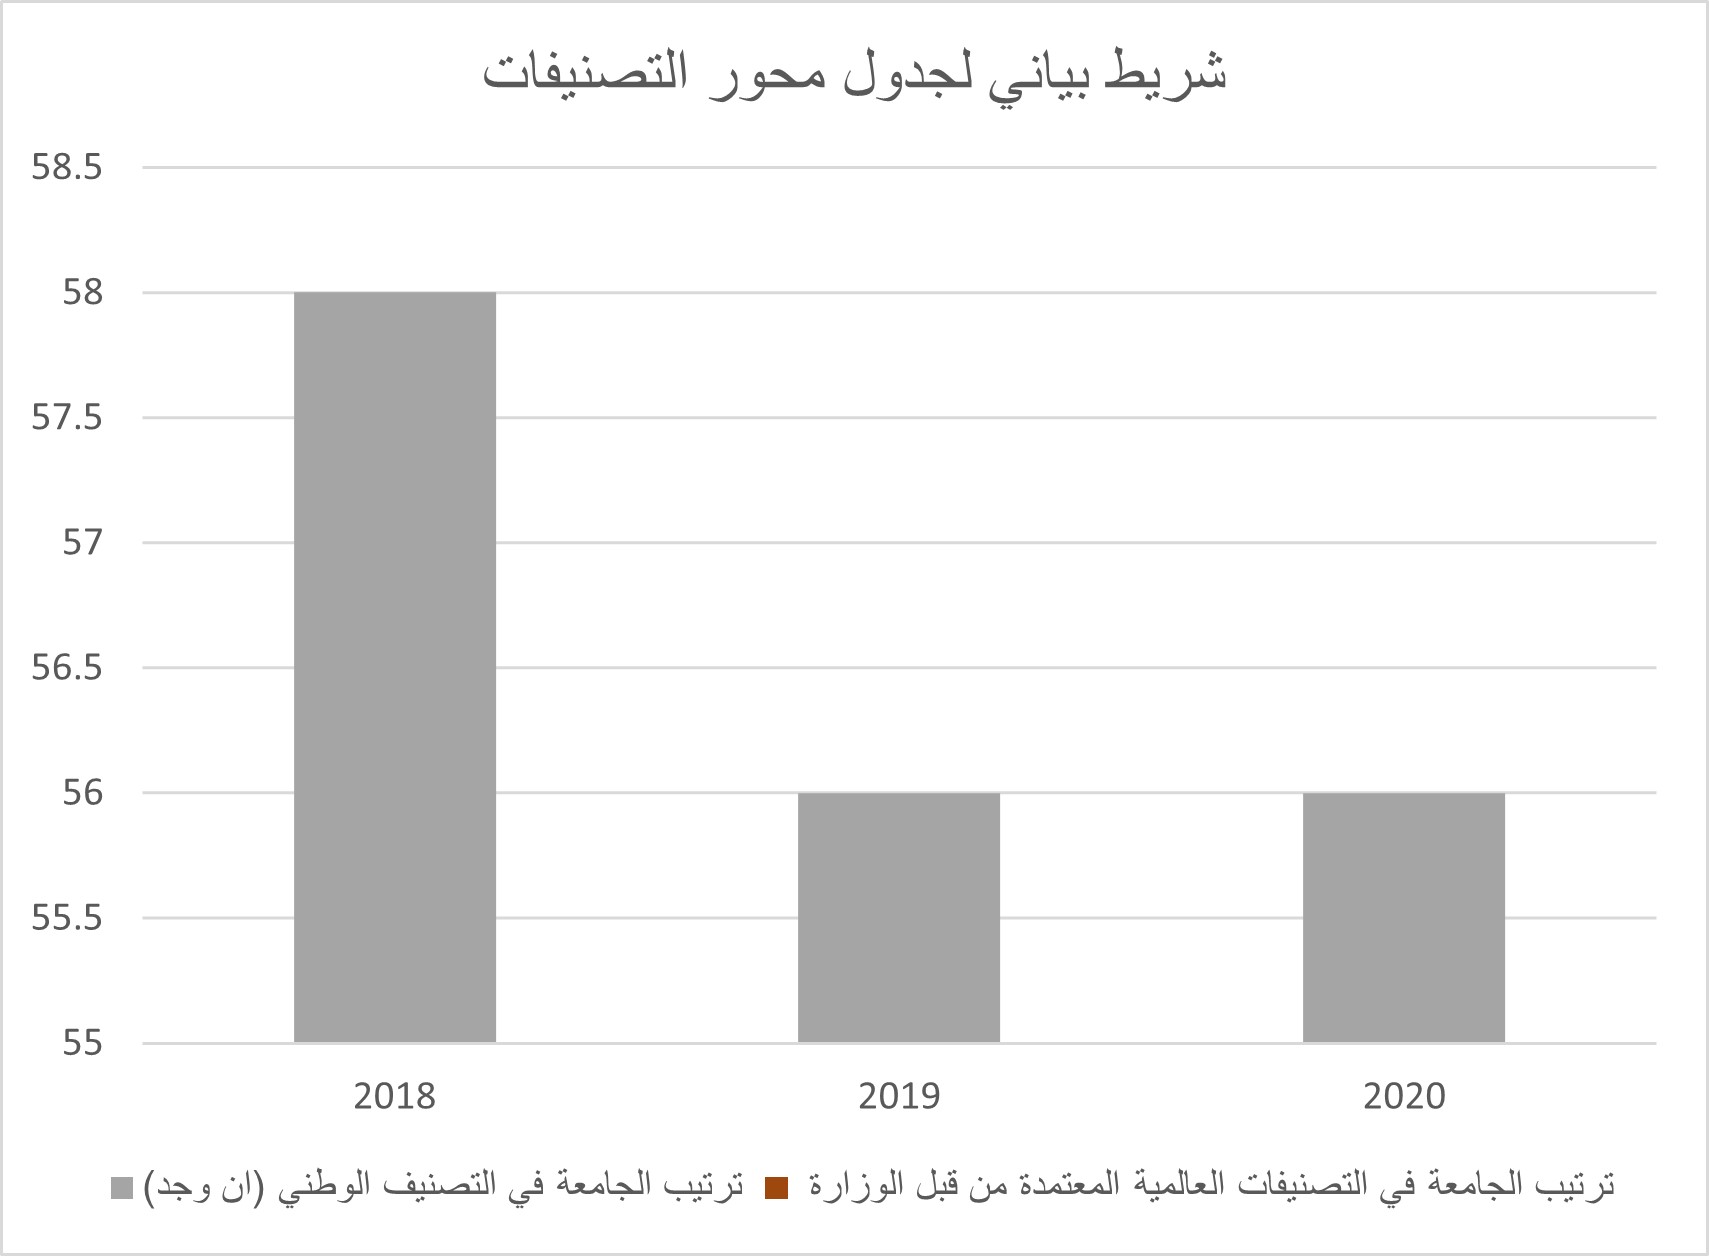
Axis of classifications
| Academic year | University ranking in national rankings (if any) | The university's ranking in international rankings approved by the Ministry |
| 2018 | 58 | 0 |
| 2019 | 56 | 0 |
| 2020 | 56 | 0 |